2023-09-05: How to Profile FPS in Unity
How to profile FPS with Unity
Let’s say my game is running like dog poop and I need to improve the FPS.
(20,000 shopping carts moving around aimlessly within a boundary)

- In Unity: Window -> analysis -> Profiler (or Ctrl+7)
- Start the game (make sure the red recording toggle is switched on!)
- Clicking on the graph on the Profile Mechanic (E.g. CPU Usage) will open the Timeline:
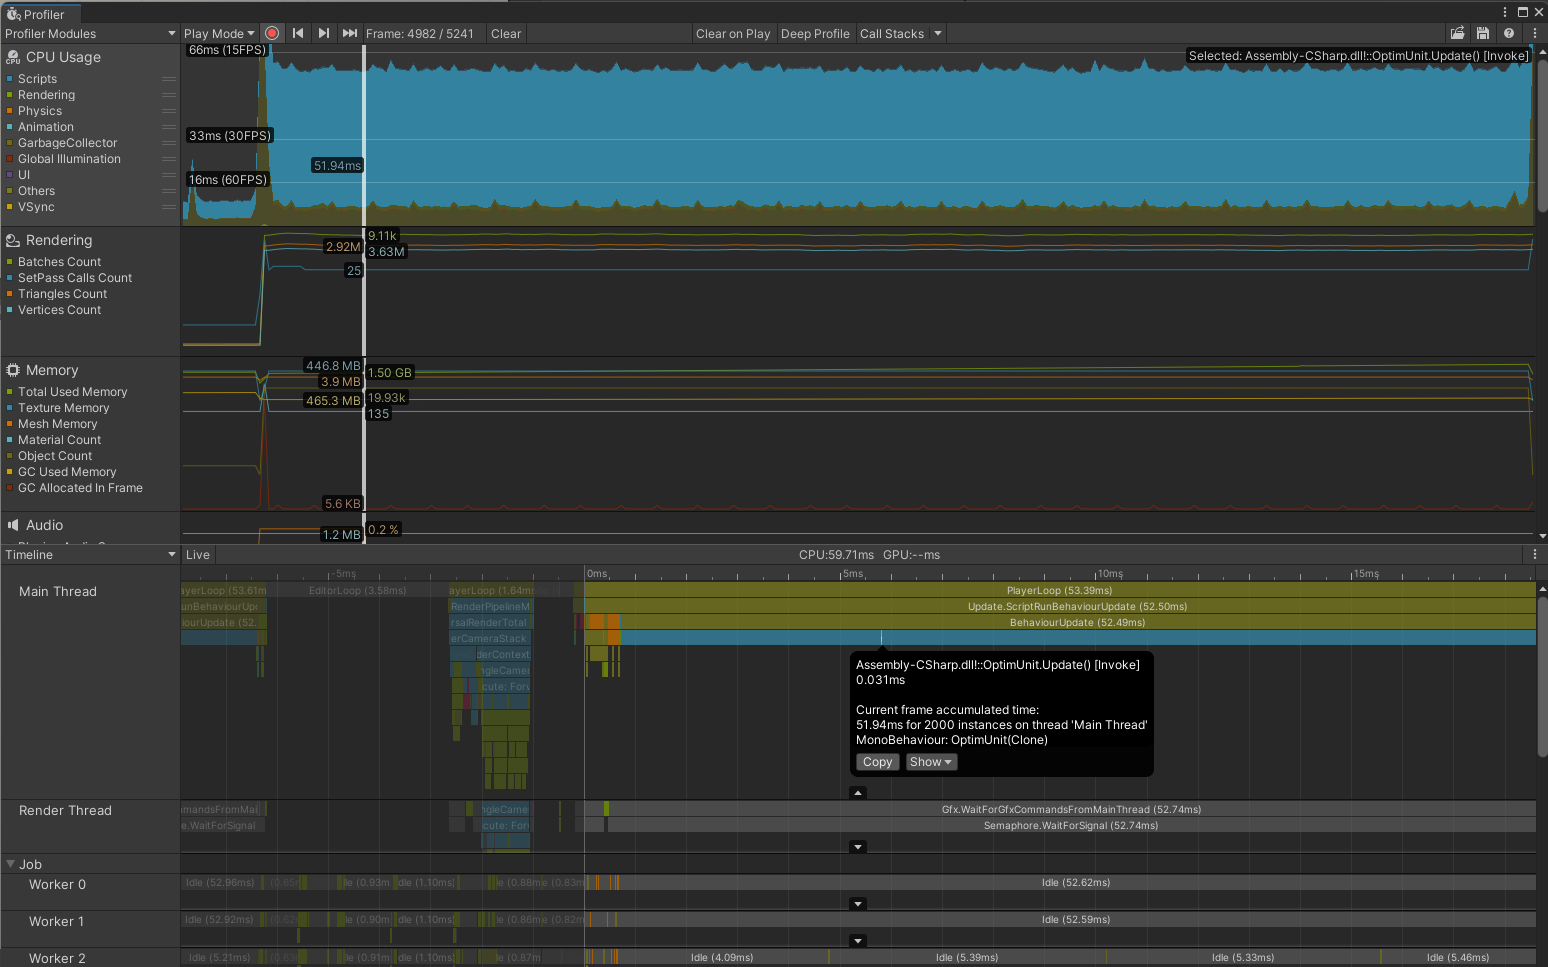
- Identify the biggest bottleneck using the graph section
- Identify the culprit script(s) using the timeline section.
- Add new tags in the culprit script to profile a snippet of code, then repeat the test.
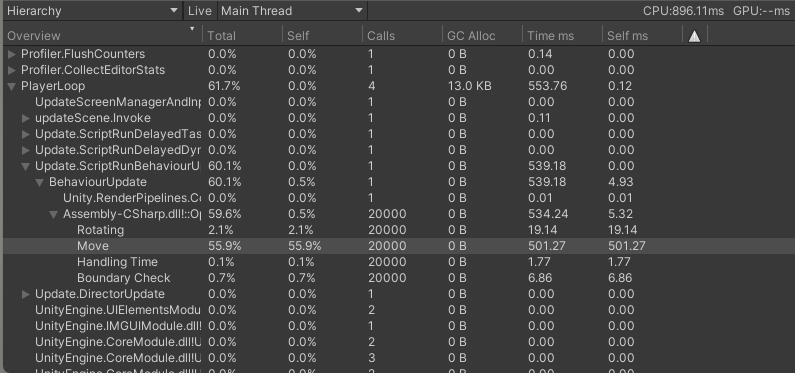
Profiler.BeginSample("Move"); Move(); Profiler.EndSample(); - Change the “timeline” to “Hierarchy” view and drill down of the script:
Side note: Formula for calculating the “Frame Budget” (also called Time Budget):
- Targeting 30FPS = (1000 ms / 30 fps) = time budget of 33.33 ms per frame
- Targeting 60FPS = (1000 ms / 60 fps) = time budget of 16.33 ms per frame